
Page 142 - 《广西植物》2023年第8期
P. 142
1 4 8 4 广 西 植 物 43 卷
表 2 新冠疫情暴发后全球生物多样性热点国家的森林损失面积与 GDP 和
每百万人口感染数量的线性混合模型系数
Table 2 Coefficients of linear mixed models for forest loss area versus GDP and infections per million
population in global biodiversity hotspot countries after COVID ̄19 outbreak
中小规模农业占用 大规模农业扩张 人工林和天然林采伐
系数 城市扩张
Small ̄ and medium ̄scale Large ̄scale agriculture Artificial and natural
Coefficient Urban expansion
agriculture occupancy expansion forests harvesting
截距 0.34 2.00×10  ̄3 0.22 0.37
Intercept
GDP -1.00×10  ̄6 2.83×10  ̄7 -2.80×10  ̄6 9.10×10  ̄6
每百万人口感染数量 <0.00×10  ̄8 -1.56×10  ̄8 -6.00×10  ̄8 <0.00×10  ̄8
Infections per million population
随机效应方差 0.15 <0.01 0.08 0.63
Random effect variance
固定效应 R 2 0.02 0.17 0.03 0.05
Fixed effect R 2
R 2 0.99 0.96 0.99 0.99
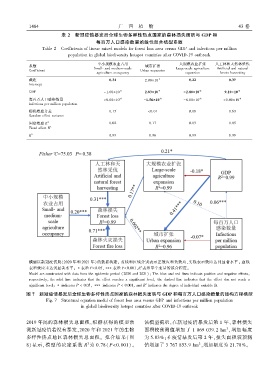
模型以新冠疫情期(2020 年和 2021 年)的数据构建ꎻ 蓝线和红线分别表示正效应和负效应ꎬ实线表示效应达到显著水平ꎻ 虚线
2
表示效应未达到显著水平ꎻ ∗表示 P<0.05ꎬ∗∗∗表示 P<0.001ꎬR 表示单个变量的拟合程度ꎮ
Model are constructed with data from the epidemic period (2020 and 2021)ꎻ The blue and red lines indicate positive and negative effectsꎬ
respectivelyꎬ the solid line indicates that the effect reaches a significant levelꎬ the dashed line indicates that the effect don not reach a
2
significant levelꎻ ∗ indicates P < 0.05ꎬ ∗∗∗ indicates P < 0.001ꎬ and R indicates the degree of individual variable fit.
图 7 新冠疫情暴发后全球生物多样性热点国家的森林损失面积与 GDP 和每百万人口感染数量的结构方程模型
Fig. 7 Structural equation model of forest loss area versus GDP and infections per million population
in global biodiversity hotspot countries after COVID ̄19 outbreak
2019 年间的森林损失总面积ꎬ根据获得的模型预 该模型揭示ꎬ在新冠疫情暴发后第 1 年ꎬ森林损失
2
测新冠疫情若没有暴发ꎬ2020 年和 2021 年的生物 面积较预测值增加了 1 069 039.2 hm ꎬ增加幅度
多样性热点地区森林损失总面积ꎮ 拟合结果( 图 为 5.83%ꎻ在疫情暴发后第 2 年ꎬ损失面积较预测
2 2
8)显示ꎬ模型的决定系数 R 为 0.78( P<0.001)ꎮ 值增加了 3 767 853.9 hm ꎬ增加幅度为 21.78%ꎮ