
Page 122 - 《广西植物》2023年第11期
P. 122
2 0 8 2 广 西 植 物 43 卷
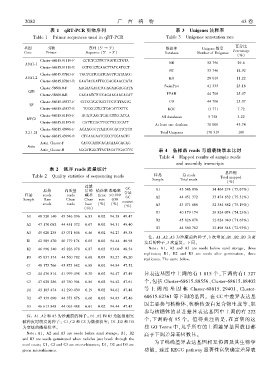
表 1 qRT ̄PCR 引物序列 表 3 Unigenes 注释率
Table 1 Primer sequences used in qRT ̄PCR Table 3 Unigenes annotation rate
基因 引物 序列 (5′ ➝ 3′) 数据库 Unigene 数量 百分比
Percentage
Gene Primer Sequence (5′ ➝ 3′) Database Number of Unigenes
(%)
Cluster ̄68615.91119 ̄F CCTCTCCTTCTTGGTCCTGTA
AUX1 ̄1 NR 52 796 29.6
Cluster ̄68615.91119 ̄R GGTGGCTCAACTTATGATGCT
NT 33 746 18.92
Cluster ̄68615.87861 ̄F TGCTCATCCATCAGTTCATAACC
AUX1 ̄2 KO 20 019 11.22
Cluster ̄68615.87861 ̄R GAATACGATTGCGAGGAACCATA
SwissProt 41 335 23.18
Cluster ̄58608.0 ̄F AAGAAGACCTCCAGAAGAGCATA
CH3
Cluster ̄58608.0 ̄R GACAATCTCCCAGAACAACACAT PFAM 44 706 25.07
Cluster ̄68615.45537 ̄F CTTCCTGCTGCTTTCTCTTAGTG GO 44 706 25.07
TF
Cluster ̄68615.45537 ̄R TGCGGCTGCTCAGATTATTG KOG 13 771 7.72
Cluster ̄68615.81195 ̄F AGATCAGCTCAGCTTCCATCA All databases 5 758 3.22
MYC2
Cluster ̄68615.81195 ̄R CATTCCAGTTCCTTCGCCATT
At least one database 78 000 43.74
Cluster ̄68615.43996 ̄F ACAAGGGTTAATGGGACTTCTCT
3.2.1.21 Total Unigenes 178 319 100
Cluster ̄68615.43996 ̄R CTGAAGAATCGCCTCCAAGTG
Actin_Cluster ̄F CACCGATTGACACAAGGAGAG
Actin
Actin_Cluster ̄R AGGATGGCTTACTACATTGACTTC 表 4 各样品 reads 与组装转录本比对
Table 4 Mapped results of sample reads
and assembly transcripts
表 2 测序 reads 质量统计
样品 总 reads 总匹配
Table 2 Quality statistics of sequencing reads Total mapped
Sample Total reads
(%)
过滤
GC
原始 高质量 后的 错误率 准确率 含量 A1 45 546 096 34 464 274 (75.67%)
样品 reads reads 碱基 Error >0.999
GC A2 44 451 372 33 474 832 (75.31%)
Sample Raw Clean Clean rate Q30
content
reads reads base (%) (%) A3 43 071 606 32 384 682 (75.19%)
(%)
(Gb)
B1 40 179 174 29 824 074 (74.23%)
A1 48 520 140 45 546 096 6.83 0.02 94.38 49.47
B2 45 826 078 32 824 940 (71.63%)
A2 47 170 082 44 451 372 6.67 0.02 94.31 49.40
B3 44 560 782 32 498 548 (72.93%)
A3 45 620 238 43 071 606 6.46 0.02 94.27 49.38
注: A1、A2、A3 为沙藏前的种子ꎬ3 次重复ꎻB1、B2、B3 为萌
B1 42 589 470 40 179 174 6.03 0.02 94.44 46.98
发后的种子ꎬ3 次重复ꎮ 下同ꎮ
B2 46 996 340 45 826 078 6.87 0.03 93.04 48.54 Note: A1ꎬ A2 and A3 are seeds before sand storageꎬ three
replicatesꎻ B1ꎬ B2 and B3 are seeds after germinationꎬ three
B3 45 637 374 44 560 782 6.68 0.03 93.27 48.20
replicates. The same below.
C1 48 175 766 45 873 682 6.88 0.02 94.84 47.52
C2 44 436 814 41 999 498 6.30 0.02 94.47 47.49 异表达基因中上调的有 1 815 个ꎬ下调的有1 327
C3 47 628 286 45 760 904 6.86 0.02 94.42 47.61 个ꎬ包括 Cluster ̄68615.88556、Cluster ̄68615.88402
D1 43 183 474 41 290 430 6.19 0.02 94.61 47.48 等 上 调 的 基 因 和 Cluster ̄68615. 29401、 Cluster ̄
68615.62361 等下调的基因ꎮ 在 CC 中差异表达基
D2 47 139 690 44 373 676 6.66 0.02 94.83 47.46
因主要参与核糖体、核糖核蛋白复合物生成等ꎬ如
D3 46 613 848 44 063 488 6.61 0.02 94.44 47.45
参与核糖体的显著差异表达基因中上调的有 222
注: A1、A2 和 A3 为沙藏前的种子ꎻ B1、B2 和 B3 为胚根刚突
个ꎬ下调的有 95 个ꎮ 值得关注的是ꎬ在富集的这
破种皮时萌发的种子ꎻ C1、C2 和 C3 为微根状茎ꎻ D1、D2 和 D3
为变绿的微根状茎ꎮ 些 GO Terms 中ꎬ几乎所有的上调差异基因数目都
Note: A1ꎬ A2 and A3 are seeds before sand storageꎻ B1ꎬ B2 高于下调差异基因数目ꎮ
and B3 are seeds germinated when radicles just break through the
为了明确差异表达基因相互协调及其生物学
seed coatsꎻ C1ꎬ C2 and C3 are microrhizomesꎻ D1ꎬ D2 and D3 are
green microrhizomes. 功能ꎬ 通过 KEGG pathway 显著性富集确定差异表